




Abstract
Abstract concepts — justice, theory, availability — have no single perceivable referent; in the human brain, their meaning emerges from a web of experiences, affect, and social context. Do large language models (LLMs) ground abstract concepts in a similar way? We study this by replicating property-generation experiments from cognitive science on 21 frontier and open-weight LLMs.
Across models and experiments, we find a consistent pattern: when compared to humans, models rely too heavily on word associations, and underproduce properties tied to emotion and internal states. This yields a large and consistent grounding gap: no model exceeds a Pearson correlation r = 0.37 with human responses, compared to a human-to-human ceiling above r = 0.9.
To better interpret this gap, we also replicate a rating experiment on grounding categories and find that here LLMs align more closely with human judgment, and alignment improves as models get larger. We then use sparse autoencoders (SAEs) to inspect whether this information is also reflected in the models' internal features, and we do identify features connected to grounding dimensions such as “sensorimotor” and “social”.
These findings suggest that current LLMs can recover grounding dimensions when explicitly queried, but do not recruit them in a human-like way when words are generated freely.
- 21 frontier and open-weight LLMs evaluated
- r ≤ 0.37 best model–human alignment on property generation
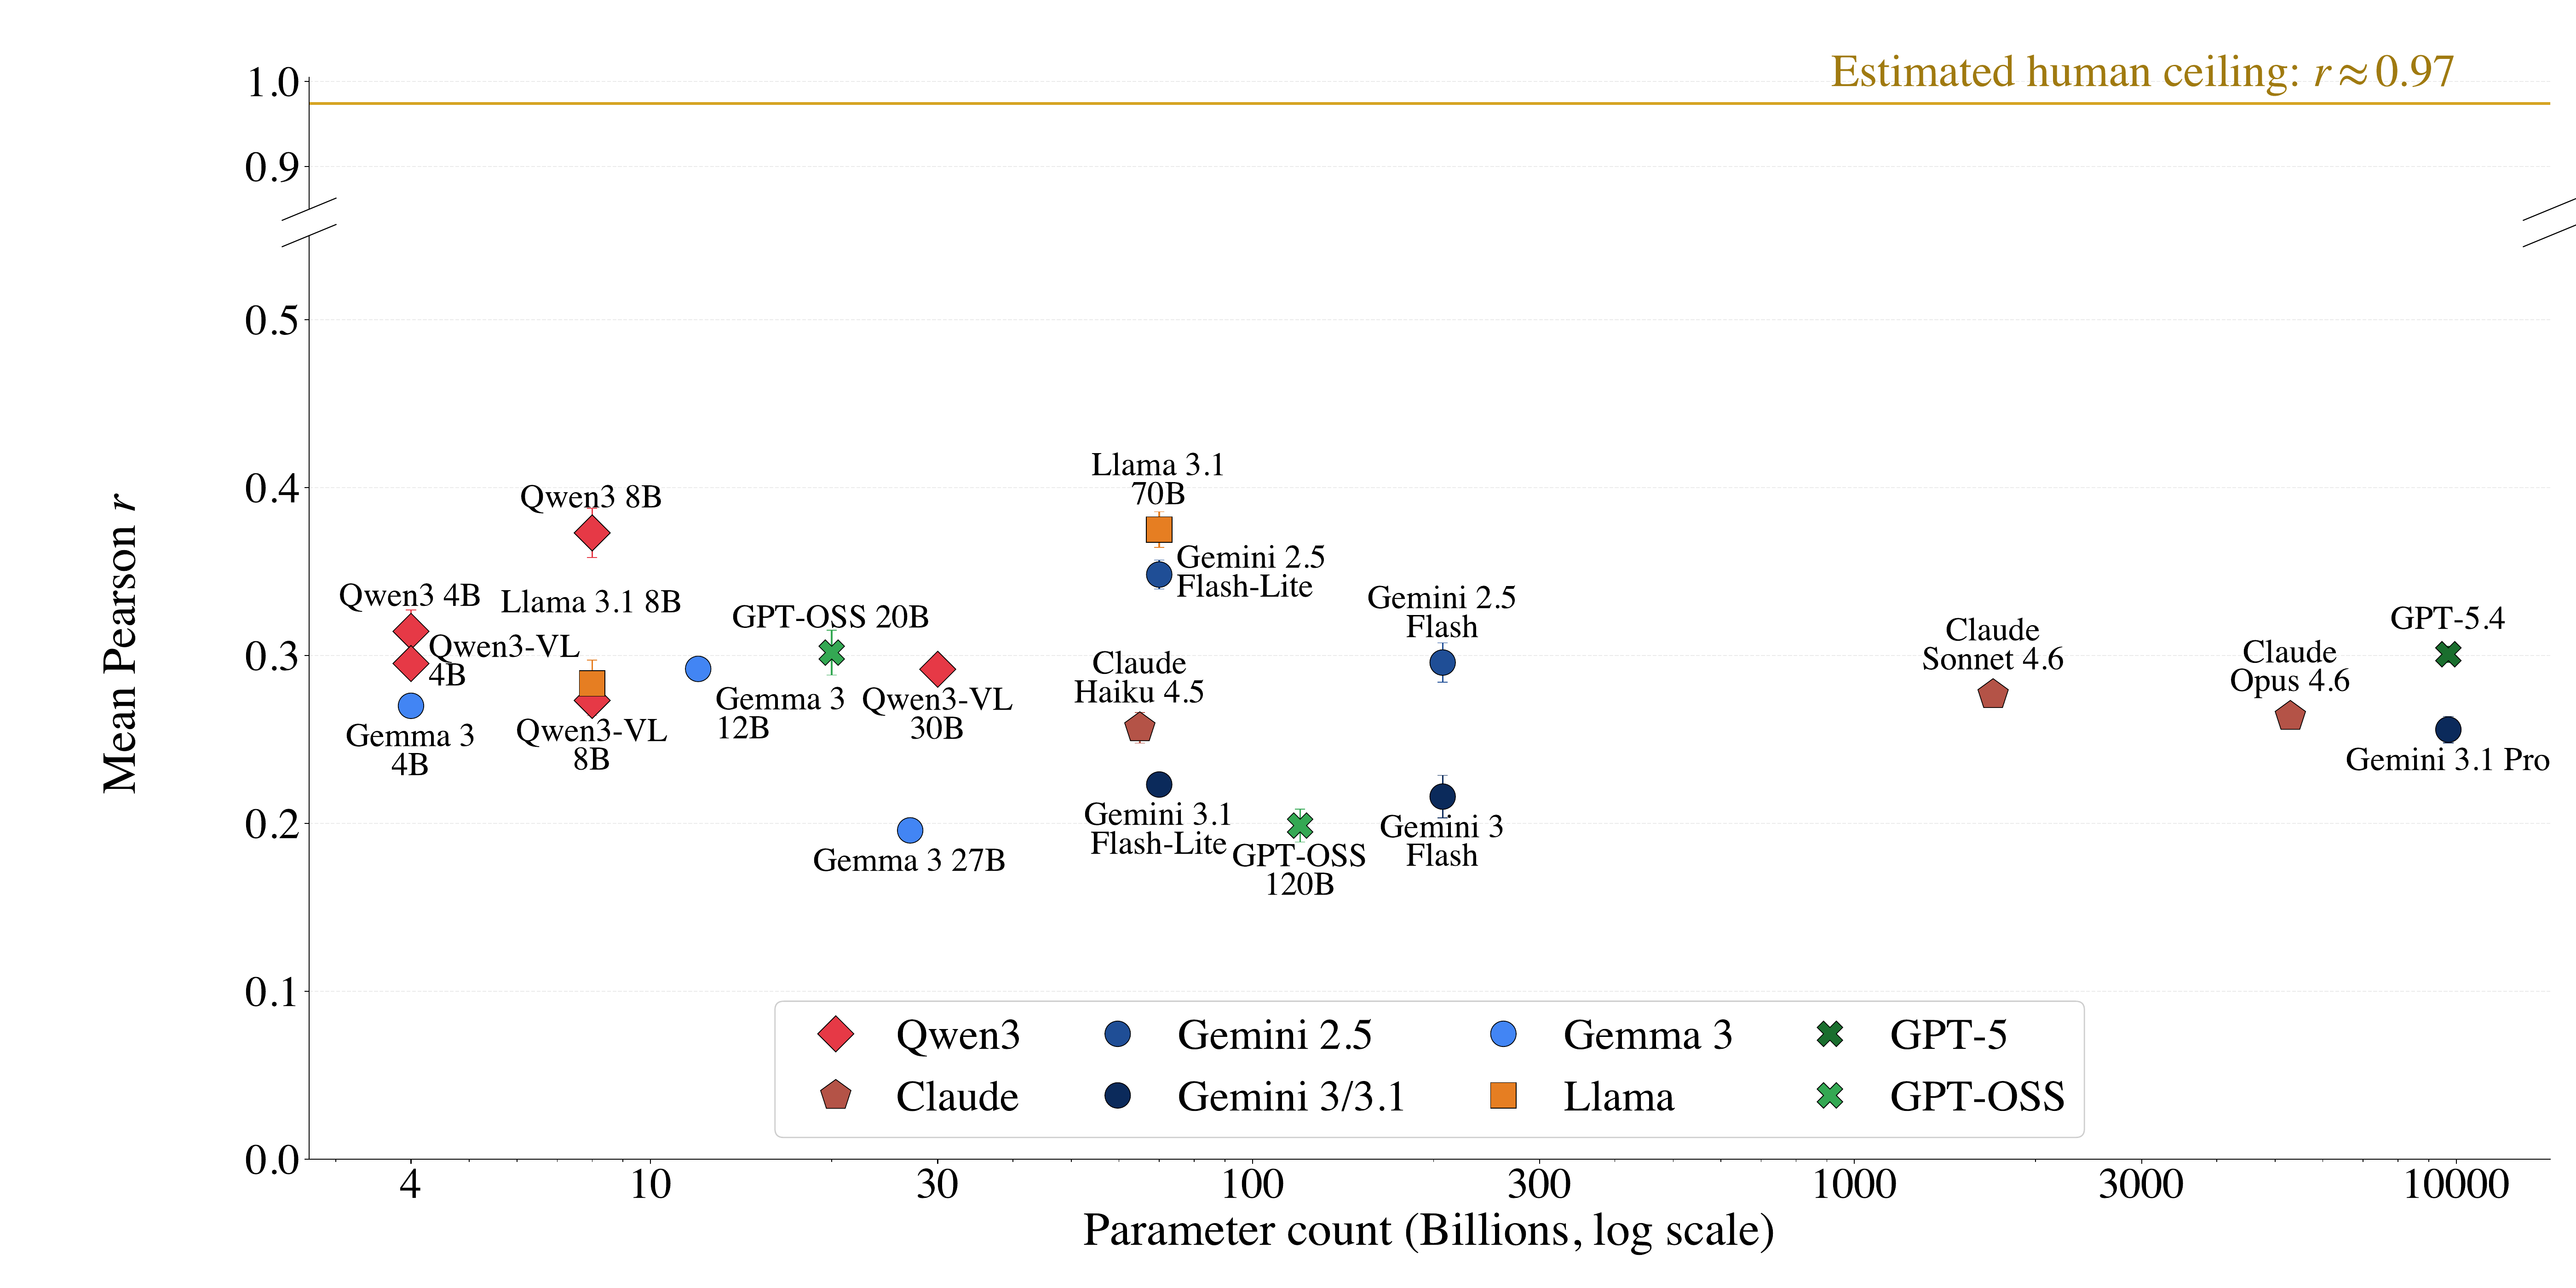
- r ≈ 0.97 estimated human–human ceiling
- 3 cognitive-science experiments replicated
The grounding gap
Models over-produce verbal associations and under-produce internal states — and they do it together, as a family.
In the property-generation paradigm, participants — humans in the original studies, models in ours — are given a concept and asked to list the properties, situations, or associations that come to mind. Individual answers vary, but the coded distributions across human participants are highly consistent: people anchor abstract concepts along grounding dimensions such as sensorimotor experience, emotion, and social context in a stable way.
Relative to humans, frontier models generate substantially more Verbal Association properties and substantially fewer Internal State & Emotion properties. Sensorimotor frequencies stay closer to the human range in aggregate, and Social frequencies are broadly comparable — though that category is sparse for humans and models alike.
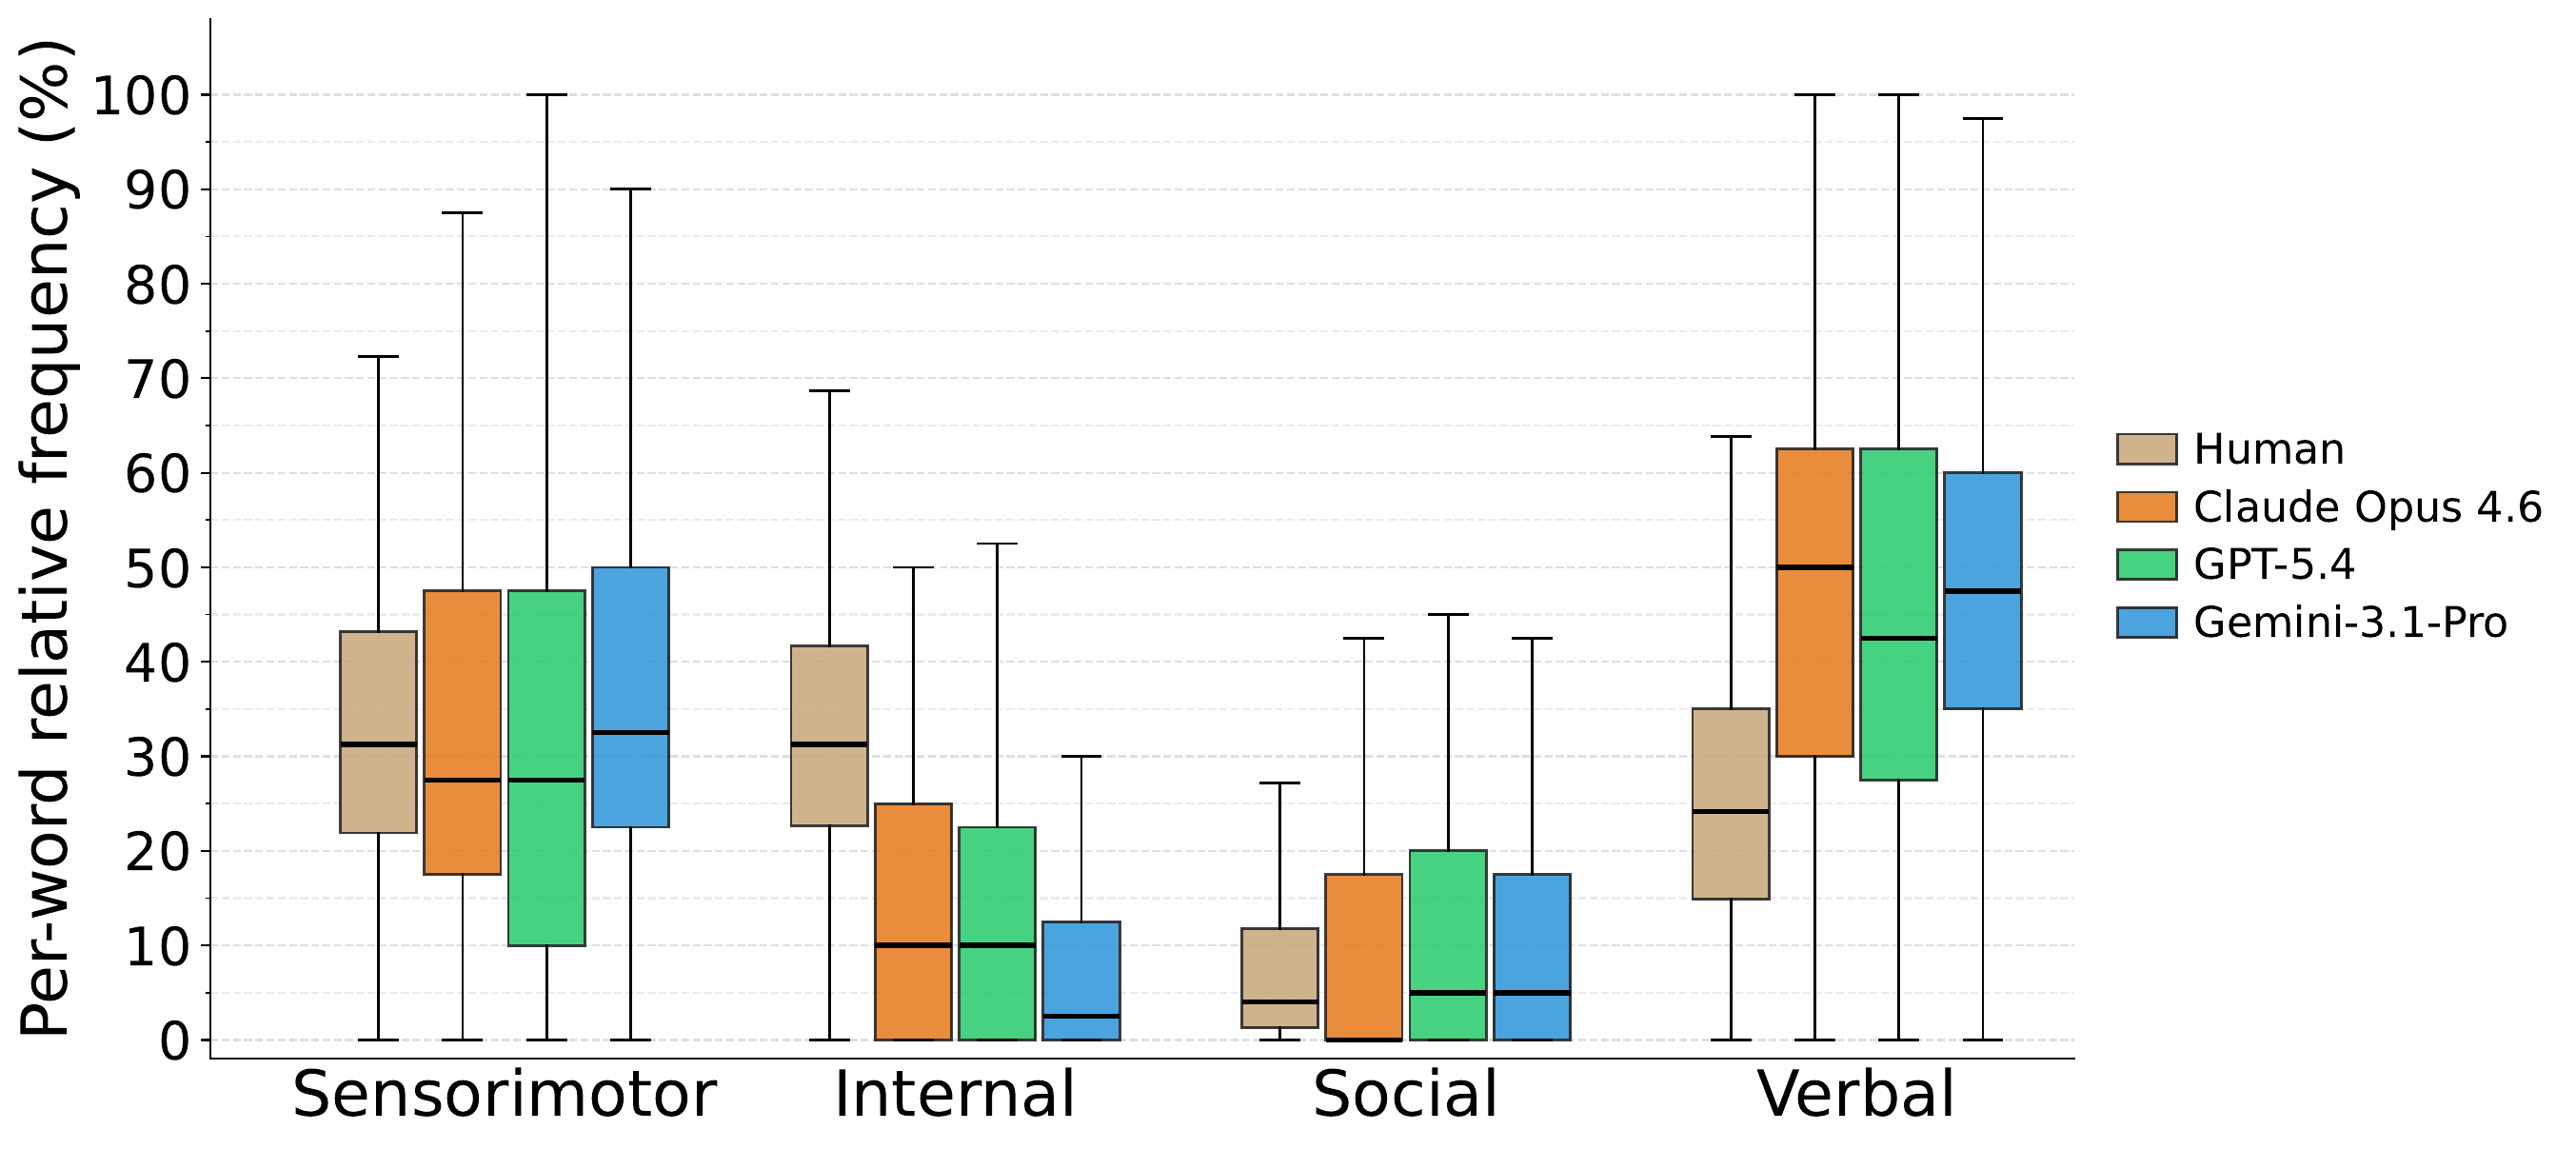
Aggregate frequency alone does not show whether models ground the same concepts in the same way. A model could produce a human-like number of Sensorimotor properties overall while attaching them to different words. Measuring alignment directly — Pearson correlation between human and model category frequencies across the stimulus set — human–model alignment stays far below the estimated human–human ceiling for all 21 models.
The best model reaches only mean r ≈ 0.37 against an estimated human ceiling near 0.97. Scale does not explain the gap: larger models and stronger general-purpose systems do not show reliably higher human alignment, so the mismatch is not simply a capability bottleneck that shrinks with size.
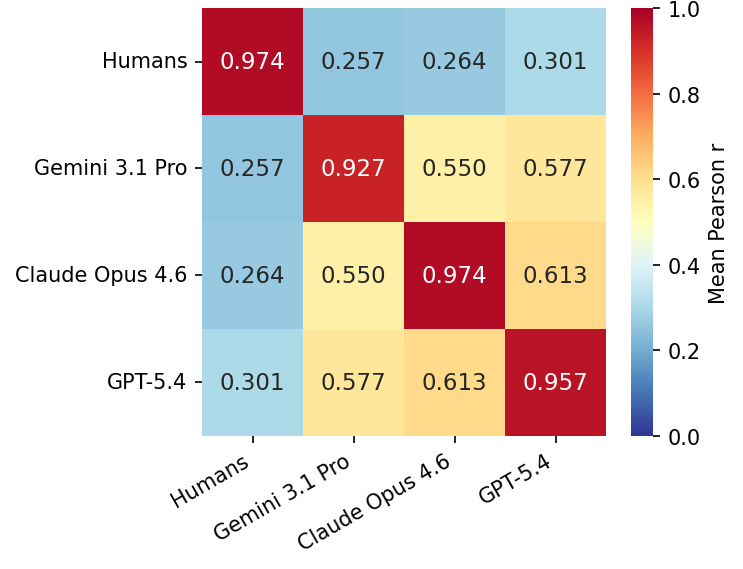
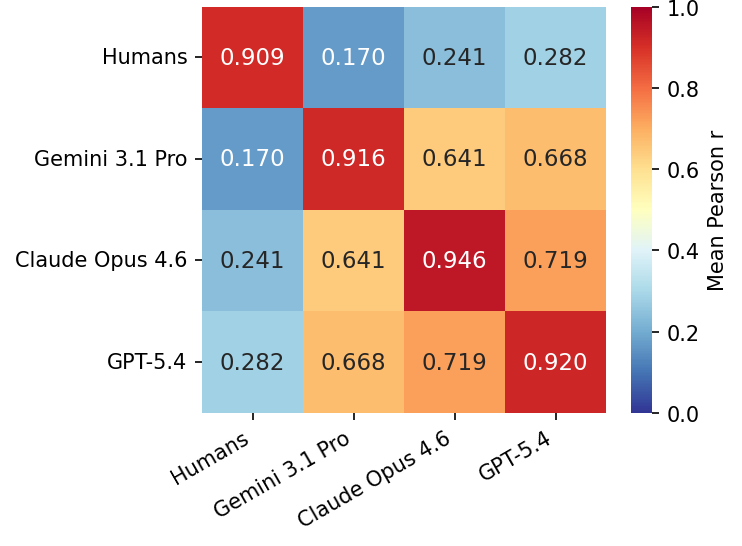
Models are also much closer to one another than to humans: model–model correlations are systematically higher than model–human correlations. Current LLMs exhibit a shared mode of grounding abstract concepts that is systematically different from the human one.
Models know the dimensions
Asked directly, LLMs rate words along grounding dimensions much like humans — and here scale does help.
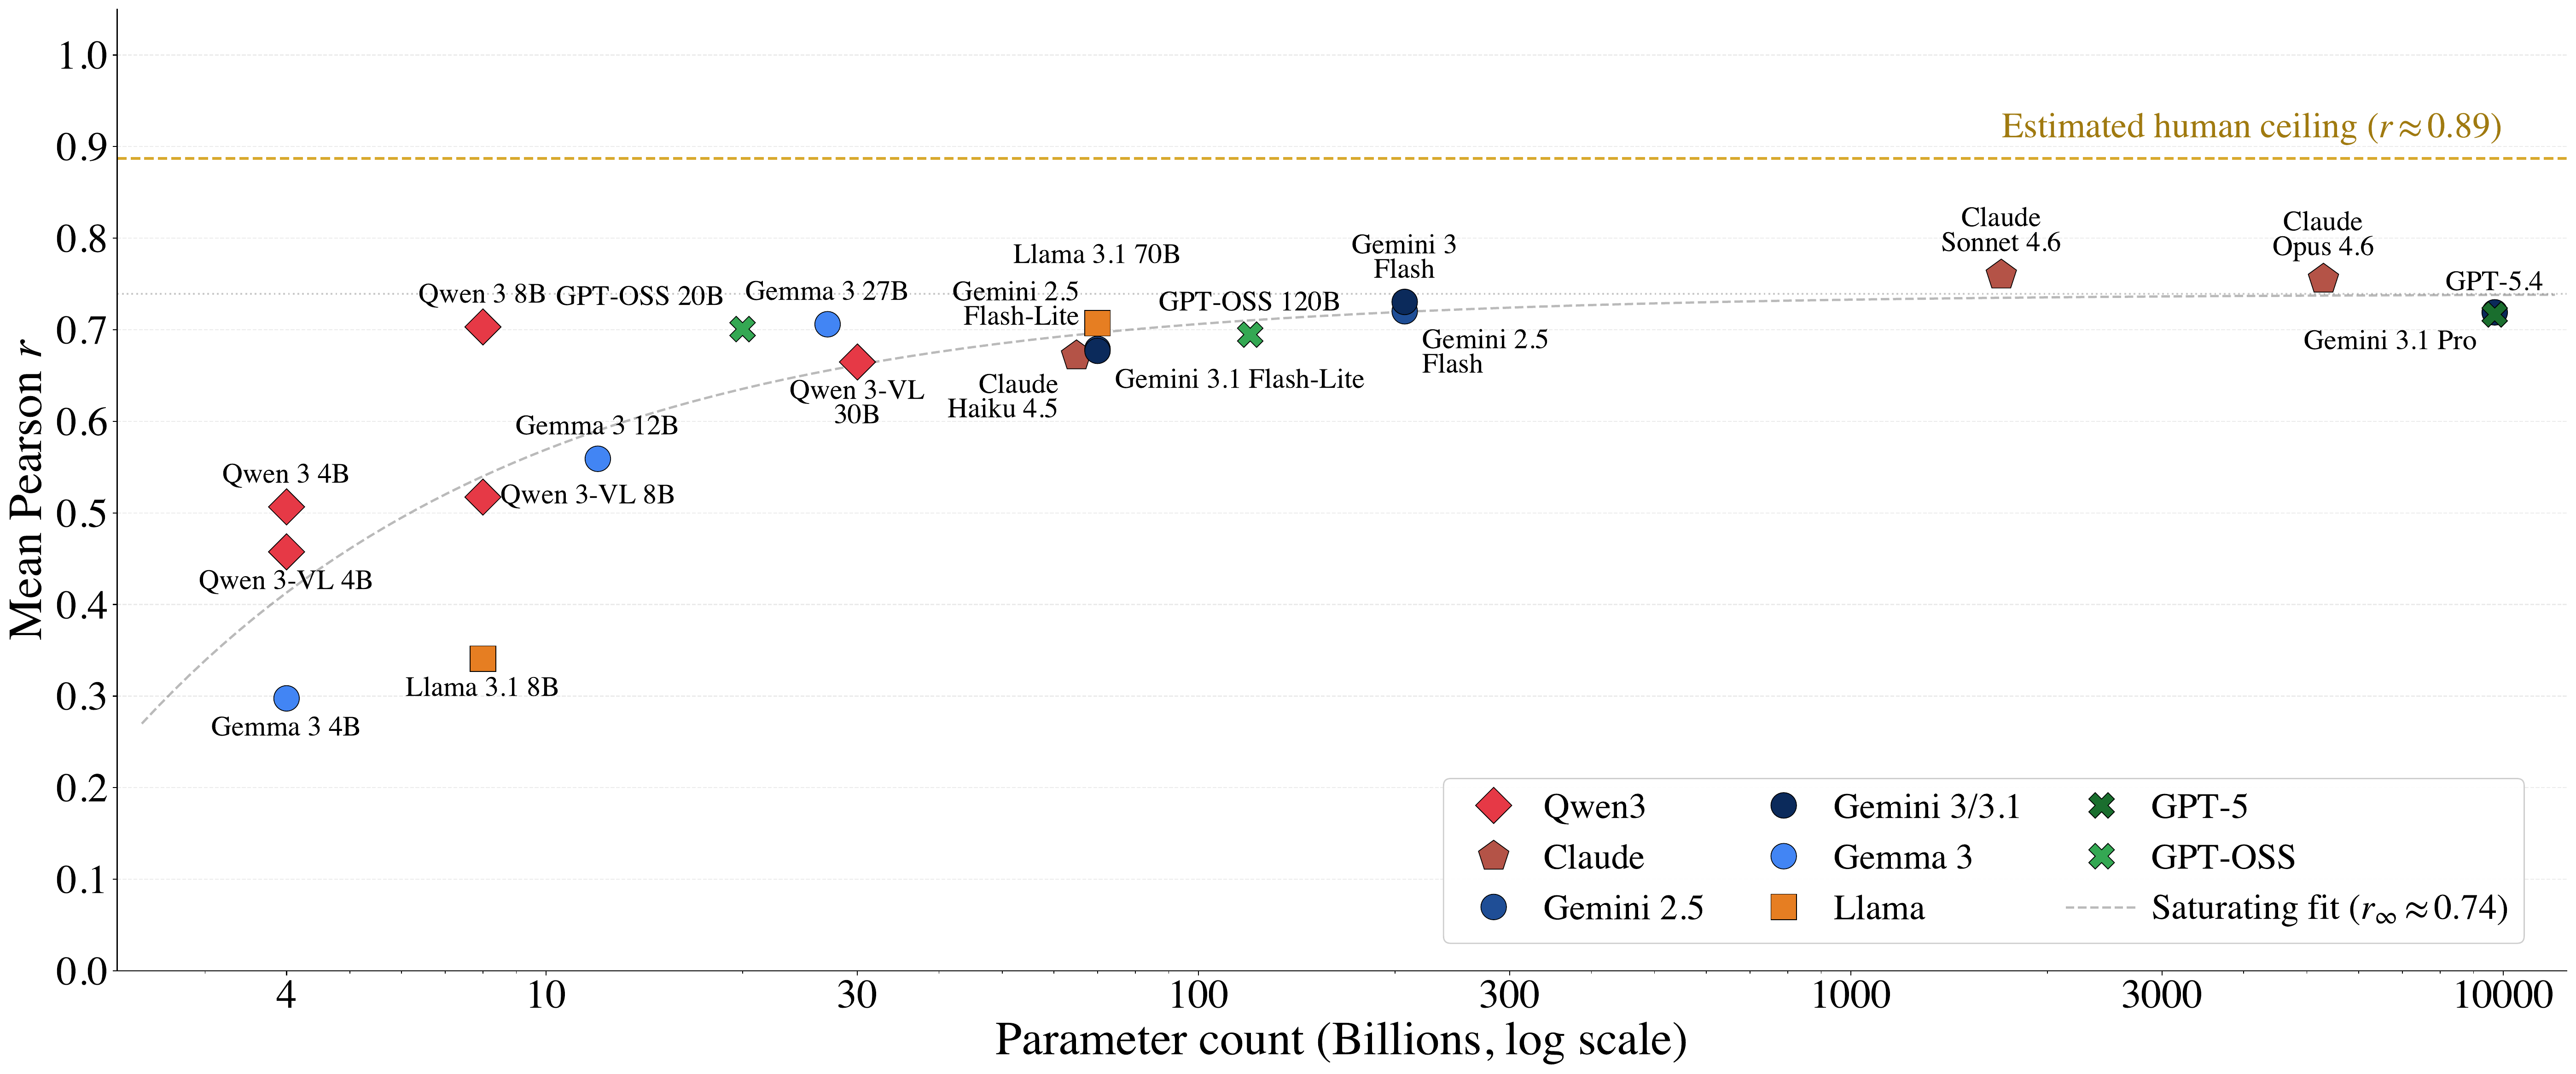
Does the gap arise because models lack an understanding of the categories that structure human grounding, or because that understanding is not recruited when concepts are generated freely? To find out, we replicate a rating experiment (Troche et al. 2017) in which 751 English nouns are rated on 14 dimensions using a 1–7 Likert scale.
The dimensions cover sensory content (Color, Taste/Smell, Tactile, Visual Form, Auditory), motor content (Self-Motion), internal and evaluative content (Emotion, Polarity, Morality, Thought), social content (Social), and magnitude-related content (Space, Quantity, Time). Using the original prompt “I relate this word to [X]”, we evaluate the same 21 models over 10 shuffled runs each.
The results differ sharply from property generation. The strongest model reaches mean r ≈ 0.76 against an estimated human ceiling of about 0.89, and alignment improves substantially with model scale. The grounding gap is therefore not an inability to recognise sensation, emotion or sociality — those dimensions are available when the task makes them explicit.
Inside the model
Sparse autoencoders surface internal features that track grounding dimensions — including the ones behaviour gets wrong.
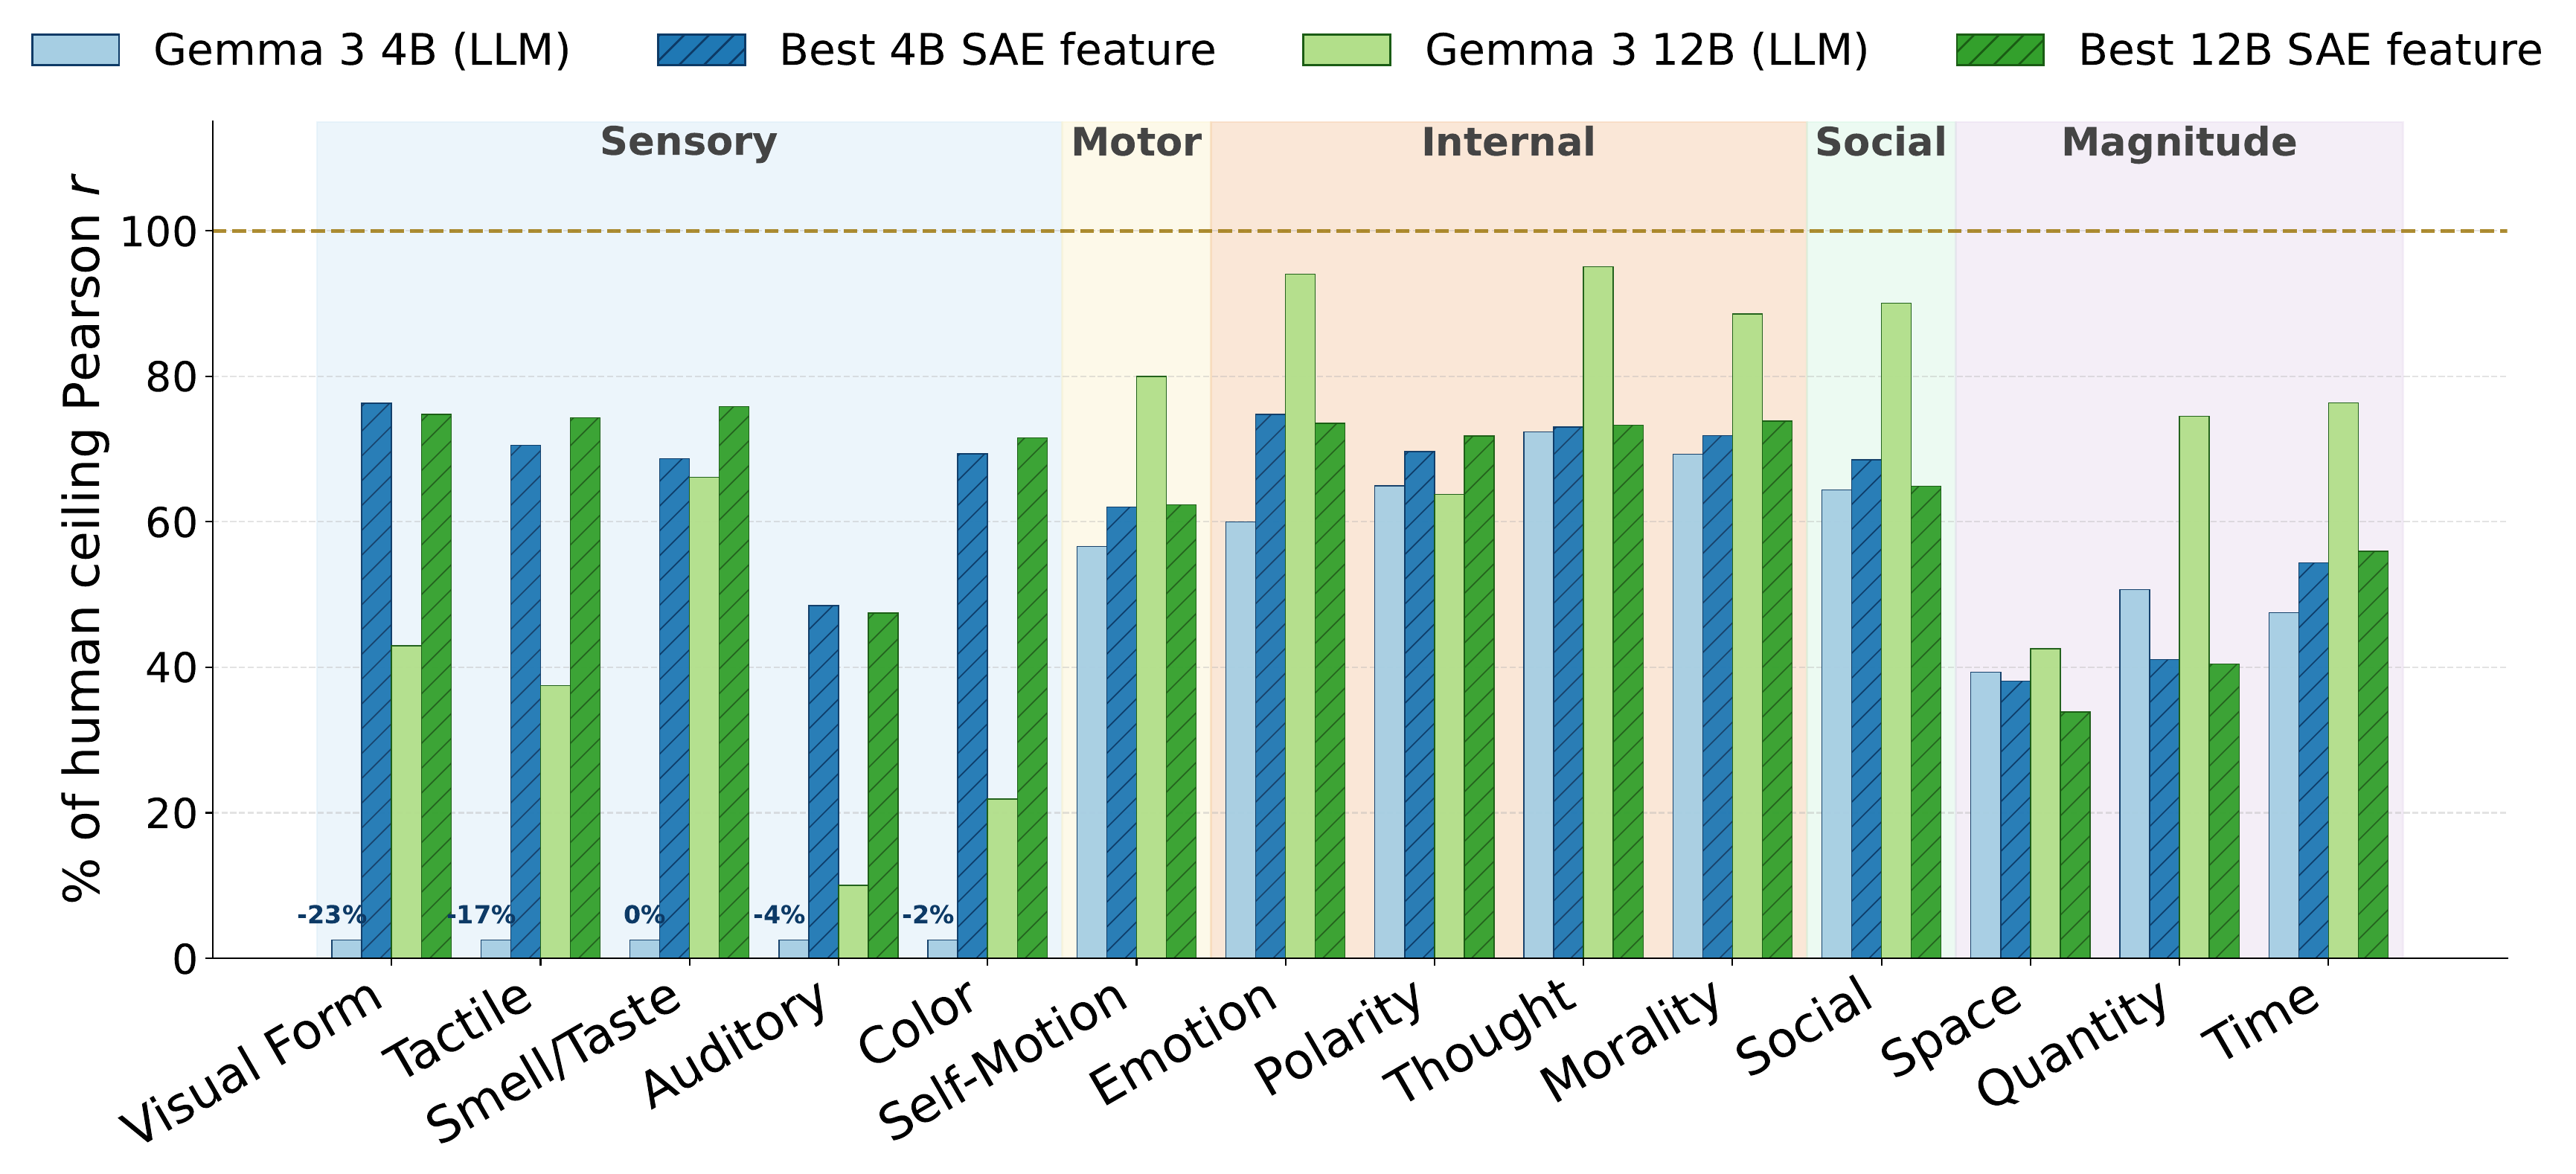
If models can recover grounding dimensions when queried, is that information also reflected in their internal representations? We analyse Gemma-3 models with sparse autoencoders (SAEs), searching for features whose activations track the human grounding dimensions. Three prompt phrasings are extracted and averaged, so the surfaced features are stable across wording rather than artefacts of a single prompt.
Both models show fairly strong behavioural alignment with human ratings across most dimensions. Sensory dimensions are the main exception — model ratings stay far below the human ceiling. Nevertheless, the SAE analysis identifies features correlating with all evaluated dimensions, the behaviourally weaker sensory ones included. For most dimensions the best-matching features reach r = 0.6 to 0.8.
The main exception is the magnitude category — space, quantity and time — which shows weaker feature alignment, possibly reflecting the more abstract nature of those dimensions. These features track several sub-dimensions of grounding and align with human judgments to a degree; they should not be read as complete or fully human-like representations.
We validate these features by steering: clamping a feature to a high activation during generation increases production of properties from the corresponding target category. The interactive demo below lets you explore the features and run the clamping yourself.
Results
Full leaderboards from the supplementary material. Click any column header to sort; click a third time to restore the published order.
Experiment 1 — property generation (Harpaintner et al. 2018)
| Rank | Model | Runs | Mean r | Sensorimotor | Internal | Social | Verbal |
|---|---|---|---|---|---|---|---|
| 1 | llama-3.1-70b | 10 | 0.375 | 0.344 | 0.464 | 0.424 | 0.267 |
| 2 | qwen3-8b | 10 | 0.373 | 0.351 | 0.390 | 0.462 | 0.288 |
| 3 | gemini-2.5-flash-lite | 10 | 0.348 | 0.276 | 0.382 | 0.456 | 0.278 |
| 4 | qwen3-4b-2507 | 10 | 0.312 | 0.326 | 0.402 | 0.316 | 0.203 |
| 5 | gpt-oss-20b | 10 | 0.302 | 0.326 | 0.255 | 0.429 | 0.196 |
| 6 | openai-gpt-5.4 | 10 | 0.301 | 0.332 | 0.258 | 0.400 | 0.213 |
| 7 | gemini-2.5-flash | 10 | 0.296 | 0.291 | 0.310 | 0.364 | 0.218 |
| 8 | qwen3-vl-4b | 10 | 0.295 | 0.344 | 0.251 | 0.326 | 0.260 |
| 9 | gemma-3-12b-it | 10 | 0.292 | 0.277 | 0.283 | 0.357 | 0.251 |
| 10 | qwen3-vl-30b | 10 | 0.292 | 0.278 | 0.240 | 0.412 | 0.237 |
| 11 | llama-3.1-8b | 10 | 0.283 | 0.186 | 0.356 | 0.406 | 0.185 |
| 12 | claude-sonnet-4.6 | 10 | 0.277 | 0.287 | 0.242 | 0.352 | 0.225 |
| 13 | qwen3-vl-8b | 10 | 0.273 | 0.313 | 0.256 | 0.325 | 0.199 |
| 14 | gemma-3-4b-it | 10 | 0.270 | 0.279 | 0.266 | 0.291 | 0.244 |
| 15 | claude-opus-4.6 | 10 | 0.264 | 0.203 | 0.205 | 0.362 | 0.284 |
| 16 | claude-haiku-4.5 | 10 | 0.258 | 0.250 | 0.196 | 0.310 | 0.277 |
| 17 | gemini-3.1-pro | 10 | 0.256 | 0.307 | 0.163 | 0.383 | 0.171 |
| 18 | gemini-3.1-flash-lite | 10 | 0.223 | 0.264 | 0.134 | 0.279 | 0.216 |
| 19 | gemini-3-flash | 10 | 0.216 | 0.251 | 0.182 | 0.294 | 0.137 |
| 20 | gpt-oss-120b | 10 | 0.199 | 0.210 | 0.238 | 0.230 | 0.116 |
| 21 | gemma-3-27b-it | 10 | 0.196 | 0.262 | 0.115 | 0.262 | 0.144 |
Pearson r between model and human category-frequency distributions over 293 abstract nouns, averaged across 10 runs. Estimated human–human ceiling ≈ 0.97.
Experiment 2 — property generation (Kelly et al. 2024)
| Rank | Model | Runs | Mean r | Taxonomic | Entity | Situation | Introspective |
|---|---|---|---|---|---|---|---|
| 1 | gemma-3-12b-it | 10 | 0.357 | 0.343 | 0.183 | 0.502 | 0.399 |
| 2 | gemma-3-4b-it | 10 | 0.310 | 0.261 | 0.179 | 0.429 | 0.373 |
| 3 | openai-gpt-5.4 | 10 | 0.298 | 0.248 | 0.127 | 0.513 | 0.304 |
| 4 | claude-opus-4.6 | 10 | 0.250 | 0.106 | 0.040 | 0.542 | 0.314 |
| 5 | gemini-3.1-pro | 10 | 0.183 | -0.064 | 0.020 | 0.498 | 0.279 |
236 abstract words (118 emotion, 118 non-emotion), coded with the Kelly taxonomy.
Rating experiment — 14 grounding dimensions (Troche et al. 2017)
| Rank | Model | Seeds | Mean r | Internal | Sensory | Magnitude | emotion | polarity | social | moral | motion_self | thought | color | taste_smell | tactile | visual_form | auditory | space | quantity | time |
|---|---|---|---|---|---|---|---|---|---|---|---|---|---|---|---|---|---|---|---|---|
| 1 | claude-sonnet-4.6 | 10 | 0.760 | 0.760 | 0.839 | 0.628 | 0.872 | 0.665 | 0.827 | 0.727 | 0.583 | 0.884 | 0.841 | 0.748 | 0.844 | 0.931 | 0.830 | 0.403 | 0.704 | 0.777 |
| 2 | claude-opus-4.6 | 10 | 0.755 | 0.720 | 0.868 | 0.637 | 0.857 | 0.639 | 0.812 | 0.737 | 0.393 | 0.883 | 0.833 | 0.854 | 0.835 | 0.951 | 0.868 | 0.419 | 0.714 | 0.778 |
| 3 | gemini-3-flash | 10 | 0.730 | 0.664 | 0.889 | 0.600 | 0.844 | 0.590 | 0.793 | 0.696 | 0.189 | 0.870 | 0.863 | 0.892 | 0.861 | 0.946 | 0.881 | 0.387 | 0.670 | 0.741 |
| 4 | gemini-2.5-flash | 10 | 0.720 | 0.667 | 0.872 | 0.574 | 0.852 | 0.539 | 0.813 | 0.712 | 0.229 | 0.857 | 0.850 | 0.878 | 0.840 | 0.926 | 0.864 | 0.381 | 0.588 | 0.753 |
| 5 | gemini-3.1-pro | 10 | 0.719 | 0.653 | 0.883 | 0.576 | 0.864 | 0.641 | 0.790 | 0.631 | 0.119 | 0.876 | 0.875 | 0.871 | 0.847 | 0.945 | 0.878 | 0.419 | 0.709 | 0.601 |
| 6 | openai-gpt-5.4 | 10 | 0.717 | 0.684 | 0.846 | 0.567 | 0.839 | 0.574 | 0.737 | 0.636 | 0.432 | 0.884 | 0.837 | 0.768 | 0.858 | 0.943 | 0.825 | 0.399 | 0.600 | 0.701 |
| 7 | llama-3.1-70b | 10 | 0.707 | 0.724 | 0.729 | 0.637 | 0.828 | 0.521 | 0.832 | 0.798 | 0.495 | 0.870 | 0.768 | 0.763 | 0.755 | 0.799 | 0.561 | 0.459 | 0.674 | 0.778 |
| 8 | gemma-3-27b-it | 10 | 0.706 | 0.757 | 0.704 | 0.606 | 0.835 | 0.588 | 0.829 | 0.789 | 0.614 | 0.889 | 0.651 | 0.756 | 0.762 | 0.808 | 0.545 | 0.346 | 0.708 | 0.763 |
| 9 | qwen3-8b | 10 | 0.703 | 0.678 | 0.807 | 0.580 | 0.777 | 0.469 | 0.828 | 0.739 | 0.375 | 0.880 | 0.795 | 0.825 | 0.808 | 0.884 | 0.723 | 0.419 | 0.610 | 0.710 |
| 10 | gpt-oss-20b | 10 | 0.701 | 0.698 | 0.757 | 0.613 | 0.813 | 0.394 | 0.825 | 0.777 | 0.513 | 0.865 | 0.681 | 0.828 | 0.822 | 0.832 | 0.623 | 0.379 | 0.682 | 0.777 |
| 11 | gpt-oss-120b | 10 | 0.695 | 0.722 | 0.709 | 0.617 | 0.854 | 0.432 | 0.837 | 0.840 | 0.512 | 0.855 | 0.687 | 0.795 | 0.817 | 0.799 | 0.448 | 0.368 | 0.716 | 0.767 |
| 12 | gemini-2.5-flash-lite | 10 | 0.679 | 0.699 | 0.719 | 0.572 | 0.845 | 0.428 | 0.787 | 0.819 | 0.434 | 0.880 | 0.782 | 0.657 | 0.791 | 0.823 | 0.543 | 0.331 | 0.586 | 0.799 |
| 13 | gemini-3.1-flash-lite | 10 | 0.677 | 0.580 | 0.829 | 0.618 | 0.800 | 0.383 | 0.794 | 0.684 | -0.058 | 0.876 | 0.859 | 0.748 | 0.838 | 0.922 | 0.779 | 0.375 | 0.669 | 0.809 |
| 14 | claude-haiku-4.5 | 10 | 0.672 | 0.613 | 0.801 | 0.571 | 0.818 | 0.368 | 0.767 | 0.780 | 0.070 | 0.877 | 0.851 | 0.741 | 0.841 | 0.904 | 0.669 | 0.415 | 0.647 | 0.652 |
| 15 | qwen3-vl-30b | 10 | 0.665 | 0.713 | 0.641 | 0.607 | 0.851 | 0.345 | 0.827 | 0.795 | 0.604 | 0.859 | 0.606 | 0.681 | 0.721 | 0.779 | 0.421 | 0.381 | 0.705 | 0.733 |
| 16 | gemma-3-12b-it | 10 | 0.559 | 0.756 | 0.326 | 0.554 | 0.846 | 0.512 | 0.811 | 0.804 | 0.693 | 0.868 | 0.196 | 0.587 | 0.345 | 0.411 | 0.092 | 0.341 | 0.649 | 0.672 |
| 17 | qwen3-vl-8b | 10 | 0.517 | 0.682 | 0.300 | 0.551 | 0.844 | 0.342 | 0.764 | 0.746 | 0.557 | 0.839 | 0.176 | 0.532 | 0.399 | 0.218 | 0.173 | 0.326 | 0.640 | 0.686 |
| 18 | qwen3-4b-2507 | 10 | 0.507 | 0.665 | 0.321 | 0.499 | 0.804 | 0.398 | 0.703 | 0.762 | 0.539 | 0.787 | 0.115 | 0.467 | 0.323 | 0.454 | 0.245 | 0.270 | 0.637 | 0.589 |
| 19 | qwen3-vl-4b | 10 | 0.457 | 0.668 | 0.192 | 0.479 | 0.796 | 0.366 | 0.740 | 0.745 | 0.539 | 0.820 | 0.164 | 0.409 | 0.148 | 0.125 | 0.114 | 0.232 | 0.629 | 0.577 |
| 20 | llama-3.1-8b | 10 | 0.341 | 0.697 | -0.161 | 0.464 | 0.755 | 0.573 | 0.710 | 0.804 | 0.528 | 0.814 | -0.226 | 0.059 | -0.213 | -0.324 | -0.101 | 0.306 | 0.507 | 0.580 |
| 21 | gemma-3-4b-it | 10 | 0.297 | 0.570 | -0.086 | 0.391 | 0.540 | 0.521 | 0.580 | 0.629 | 0.490 | 0.661 | -0.014 | 0.000 | -0.155 | -0.225 | -0.036 | 0.315 | 0.441 | 0.418 |
Pearson r between mean model ratings and the Troche (2017) human norms over 751 nouns, sorted by mean r across the 14 dimensions. Scroll horizontally for per-dimension scores.
Code, data and demo
All code and data needed to reproduce the paper are public. The supplementary repository ships a preloaded sample, so both leaderboards reproduce without an API key and without a GPU.
- Supplementary repository — property-generation experiments, the rating experiment, and the SAE feature analysis, each with its own walkthrough.
- Interactive demo — an explorer for the SAE features that track grounding dimensions on Gemma-3-4B-it, with live feature clamping.
- Camera-ready paper (PDF) and the arXiv preprint.
Human norms come from Harpaintner et al. (2018) and Troche et al. (2017) under CC-BY 4.0; the Kelly et al. (2024) norms are fetched on demand from the authors' OSF project and are not redistributed.
Citation
@inproceedings{chlapanis2026groundinggap,
  title     = {The Grounding Gap: How LLMs Anchor the Meaning of Abstract Concepts Differently from Humans},
  author    = {Chlapanis, Odysseas S. and Menis Mastromichalakis, Orfeas and Papadimitriou, Christos H.},
  booktitle = {Advances in Neural Information Processing Systems (NeurIPS)},
  year      = {2026},
  url       = {https://arxiv.org/abs/2605.08837}
}